QBO Monitoring 1953-Present
MONITORING OF THE QUASI-BIENNIAL OSCILLATION
Analysis and Reconstructed Codes by Sandro Lubis
Former Graduate Student of Leipzig Institute for Meteorology, University of Leipzig, Germany, PhD Candidate in GEOMAR-Kiel, Germany
October, 2014
Introduction
QBO or Quasi-Biennial Oscillation is characterized by zonally symmetric easterly and westerly wind regimes alternating regularly with periods varying from about 24-30 months (with an average of about 28 months) in the equator. QBO propagates vertically (downward) at a rate of 1 km/month. The Oscillation is symmetric about the Equator with the average maximum amplitude of 20 m/s. Successive regimes first appear at the height of 10 mb and drop down to the height of 100 mb. The maximum Amplitude is about 40 to 50 m/s obviously observed at altitude of 20 mb.The amplitude of the easterly phase is about twice as strong as that of the westerly phase (E=(30-35 m/s), W= (15-20 m/s)). Downward motion of the easterlies is usually more irregular than that of the westerlies. Transition between westerly and easterly wind are often delayed between 30-50 mb. Below 50 mb, QBO signal change rapidly (i.e., rapid attenuation occurs below 23 km) (Naujokat 1986, Holton 2004).
Index of QBO

Fig. 2 QBO Zonal Wind Index, Jan 1979-Nov 2013. Data Source: http://www.cpc.ncep.noaa.gov/data/indices/ computed by: Sandro Lubis
The two QBO indexes are acquired from the CDAS Reanlysis data and are the zonally averaged winds at 30 and 50MB and taken from over the equator.
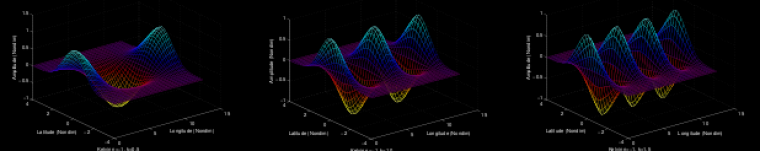
Amplitude of QBO (Extended ERA)

Animation of QBO (Vertical Propagation)
| The data are deseasoned, and detrended. Total number of weights used are 49 and 20-month low-pass filtered are applied. |
Klick this following figure!!

SOURCE OF DATA
The Quasi-Biennial-Oscillation Data Series (Freie Universität Berlin)
Climate Indices: Monthly Atmospheric and Ocen Time Series (NOAA ESRL/PSD)
Observations of the QBO

Fig 1. New updated QBO Zonal Wind from Jan 1953-Present (Aug 2014). Original Codes by NCL and Reconstructed Codes by Sandro Lubis . Indices can be downloaded here.
The data used for analyzing QBO in zonal wind were obtained from selected stations near the equator since 1953. The earlier data observations were calculated by combining the observation of the three radiosonde/rawindsonde stations Canton Island (closed 1967), Gan/Maledive Islands (closed 1975), and Singapore (-present). The measurement of QBO in zonal wind was conducted within 2 degree latitude from equator. The data were collected and computed by Barabara Naujokat (one of scientists in stratospheric research group at the Free University Berlin) from 1953 onward from Canton Island, Gan(Maledives) and Singapore. These dataset are mostly used to describe the QBO and are supposed to be representative of the equatorial belt since all studies have shown that longitudinal differences in the phase of the QBO are small (FU Berlin).It should be noted, however, that some uncertainties arose at higher levels during the early years from the scarcity of observations. More information on the original data can be found in Naujokat (1986).
| Station | Coordinates | Months |
| Canton Island (91700) | 02 46 S / 171 43 W | Jan.1953-Aug.1967 |
| Gan/Maledives (43599) | 00 41 S / 73 09 E | Sept.1967-Dec.1975 |
| Singapore (48698) | 01 22 N / 103 55 E | Jan.1976-present |
EOFs of QBO (Vertical Structure)

Experiment in NCEP/NCAR Reanalysis [I] 1948-2011
A simple analysis was conducted, zonal wind data from NCEP/NCAR Reanalysis [I] were directly used in order to identify the existence of QBO in the lower middle atmosphere during last decade (1948-2011). The chosen grid was located near the equator at 100 E and 2.5 N. The vertical average of zonal wind were computed due to an indication of the existence of QBO at 10-70 hPa. This result is consistent with previous studies (Dunkerton, 2003) show that alternating downward propagating westerly ![]() and easterly (E) regimes appear around the height of 10-70 hPa layer. Spectral analysis was applied to the average of zonal wind (10- 70hPa) from 1998-2010 giving the result that that the peak of spectral density is observed around 0.03-0.04 Hz month/cycle in other words the period of QBO cycle is obviously detected around 28 month/cycle. A 28 month/cycle is indicated by the max peak of amplitude as shown in figure. The maximum amplitude of QBO is 6.6 m/s and phase angle exceeds 160. The result of this spectral is realistic if it’s compared to the early study pointing out that QBO is associated to the alternating wind regimes repeating at intervals 22 to 34months, with an average period of slightly more than 28months (Baldwin et al., 2001, Holton and Matsuno 1984).
and easterly (E) regimes appear around the height of 10-70 hPa layer. Spectral analysis was applied to the average of zonal wind (10- 70hPa) from 1998-2010 giving the result that that the peak of spectral density is observed around 0.03-0.04 Hz month/cycle in other words the period of QBO cycle is obviously detected around 28 month/cycle. A 28 month/cycle is indicated by the max peak of amplitude as shown in figure. The maximum amplitude of QBO is 6.6 m/s and phase angle exceeds 160. The result of this spectral is realistic if it’s compared to the early study pointing out that QBO is associated to the alternating wind regimes repeating at intervals 22 to 34months, with an average period of slightly more than 28months (Baldwin et al., 2001, Holton and Matsuno 1984).


Fig 3. Amplitude Spectrum and FFT Phase of QBO
Data: 1948-2011 NCEP/NCAR Reanalysis I.

Fig 4. Zonal wind of QBO in period of 1948-2011 (snip started from 1997) from NCEP/NCAR Reanalysis [I]
Related Publications
- Naujokat, B., 1986: An update of the observed quasi-biennial oscillation of the stratospheric winds over the tropics. J. Atmos. Sci., 43, 1873-1877.
- Baldwin, M.P. et al, 2001: The Quasi-Biennial Oscillation. Reviews of Geophys., 39, 179-229.
- Andrews, D.G., J.R. Holton, and C.B. Leovy, 1987: Middle Atmosphere Dynamics. Academic Press, 489pp
- Untch, A. (1997) Observed a QBO like oscillation in a 50 level version of the ECMWF model with a semi-Lagrangian scheme. A similar model run with Eulerian advection did not produce a QBO
- Lahoz, W. et al. , report improved stratospheric representation with the UKMO Unified Model with 74 levels and ~0.8km resolution in the stratosphere. No QBO is observed, however.
- Scaife,A.A. et al have simulated the quasi-biennial oscillation (QBO) and semi-annual oscillation (SAO) in the Met Ofice Unified Model.
Related Links
The Quasi-Biennial-Oscillation (QBO) Data Series (Freie U, Berlin)
QBO: Quasi-Biennial Oscillation (UCAR)
The Quasi-Biennial zonal wind Oscillation (QBO)
QBO animation (ERA40) by Mark Baldwin
Quasi-biennial oscillation (Wikipedia)
-Sandro-
# This information will be updated monthly. Last update: October, 2014


Due to interaction of upward propagating tropical atmospheric waves (such as gravity, inertiagravity, Kelvin and Rossby-gravity waves) with the zonal wind.
Hey, Great Article !! I had a small question – Why does this oscillation QBO, move down with time ?