Global Datasets [Download Here]
GLOBAL DATASETS
Sandro Lubis
Graduate Student of Leipzig Institute for Meteorology
University of Leipzig, Germany
2012
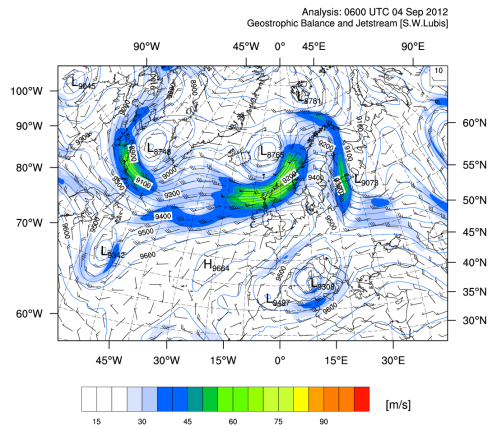
Weather Analysis: 0600 UTC 04 Sept 2012: Geostrophic Balance and Jetstream over Europe and North Atlantic from global Numerical weather prediction computer model. MP: Azimuthal Equidistant. by Sandro Lubis using NCL.
Forecast of Tropical Cyclone (TC) “KAI-TAK” near Manila, Philippines – 06 UTC 13 Aug 2012, from high resolution model overlayed with Total Precipitation (mm). Forecast Track: Taiwan (Kao-Hsiung) – Hongkong – Guiyang (China).
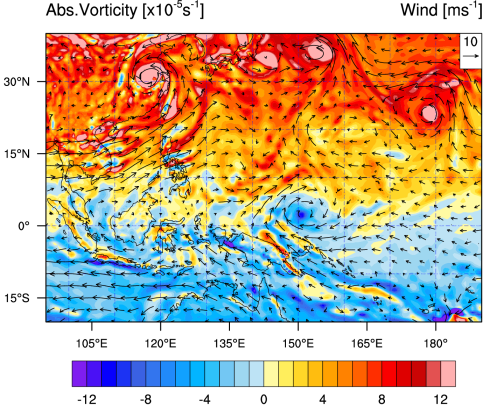
Analysis of Tropical Cyclone from High Resolution Model (Gaussian Grid) by Sandro Lubis using NCL. Swirling motions of geophysical fluids 06 UTC 9 August 2012 West Pacific. TC= Tropical Cyclone: TC Haikui – East. China Sea and TC Kirogi – Far East of Japan.
Active tropical cyclones in the Atlantic, Caribbean, and the Gulf of Mexico (Tropical Storm ERNESTO) and Active tropical cyclones in the Eastern Pacific (Hurricane GILMA ). Swirling motions of geophysical fluids 06 UTC 9 August 2012 from high resolution model
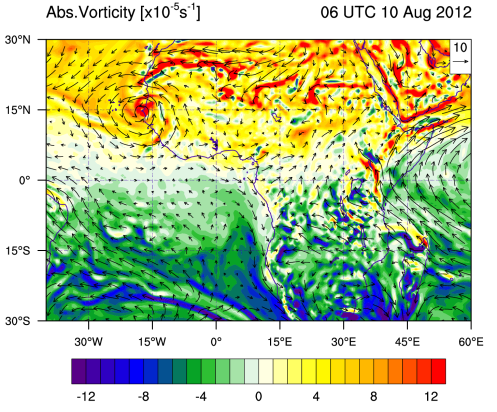
Indication of West Africa tropical storm 06 UTC 10 August 2012
Reanalysis Data
ERA-Interim Reanalysis (1989–2008)
available from 1989010100 to 2009123118, 1.5°x1.5° (from T255L60),
37 pressure level, in netCDF format
ECMWF Data Base
NCEP/NCAR Reanalysis I
Temporal Coverage:
4-times daily, daily and monthly values for 1948/01/01 to present. 2.5°x2.5°, 17 pressure levels, in netCDF format
Long term monthly means, derived from data for years 1981 – 2010
Variables: U, V, W, Geo, T, Q, RH
NCEP-DOE Reanalysis 2
Temporal Coverage:
4-times, Daily and and monthly values for 1979/01 to 2011/12, 2.5°x2.5°, 17 pressure levels, in netCDF format
Variables: Variables: U, V, W, Geo, T, Q, RH
Precipitation and OLR Data
Global Precipitation Climatology Project (GPCP)
The Global Precipitation Climatology Project (GPCP) was established by the World Climate Research Program (WCRP) to address the problem of quantifying the distribution of precipitation around the globe over many years. The general approach is to combine the precipitation information available from each of several sources into a final merged product, taking advantage of the strengths of each data type.
The data set archive consists of yearly unformatted REAL*4 binary files with ASCII headers, each of which holds 12 monthly fields. Each file occupies almost 0.5 MB. The grid on which each field of values is presented is a 2.5°x2.5° latitude–longitude (Cylindrical Equal Distance) global array of points. It is size 144×72, with X (longitude) incrementing most rapidly West to East from the Prime Meridian, and then Y (latitude) incrementing North to South. Grid edges are placed on whole- and half-degree values:
First point center = (88.75°N,1.25°E)
Second point center = (88.75°N,3.75°E)
Last point center = (88.75°S,1.25°W)
Missing values are denoted by the value -99999., and the units on the fields depend on the variable. For example, rainfall is carried as mm/day.
Tropical Rainfall Measurement Mission (TRMM)
The Tropical Rainfall Measurement Mission (TRMM) is being flown by the National Aeronautics and Space Administration (NASA, U.S.) and the Japan Aerospace Exploration Agency (JAXA, Japan) to improve our quantitative knowledge of the 3-dimensional distribution of precipitation in the tropics. TRMM has a passive microwave radiometer (TRMM Microwave Imager, TMI), the first active space-borne Precipitation Radar (PR), a Visible-Infrared Scanner (VIRS), and other instruments. Coordinated observations are intended to result in a “flying raingauge” capability.
The data set archive consists of binary data sets in Hierarchical Data Format (HDF). Each 3B42 file contains a 3-hourly estimate and each 3B43 file contains a one-month estimate. The grid on which each field of values is presented is a 0.25 deg x 0.25 deg latitude–longitude (Cylindrical Equal Distance) array of points over the latitude range 50N-S. It is size 400×1440, with X (latitude) incrementing most rapidly South to North, and then Y (longitude) incrementing West to East from the Date Line. Grid edges are located at whole-degree values:
First point center = (49.875S,179.875W)
Second point center = (49.625S,179.625W)
Last point center = (49.875N,179.875E)
Missing values are denoted by the value -9999.9, and the units are mm/hour.
Outgoing Longwave Radiation (OLR)
Uninterpolated and Interpolated gridded data are obtained from NOAA/OAR/ESRL/PSD
Temporal Coverage:
Daily values from 2002/01/01 to present
(from twice daily Advanced Very High Resolution Radiometer (AVHRR) soundings for OLR)
Global Models, Regional Models, Ocean Models, External Models
Download Here:
Atmospheric Sounding
Worldwide archive of sounding Data from Department of Atmospheric Science, University of Wyoming
NOAA/ESRL Radiosonde Database
[Continued, under construction!]


